The following is an excerpt from our whitepaper on Olark Live Chat and Google Analytics, written by David Kucher of Confluent Forms. To download the entire whitepaper, which includes step-by-step instructions for creating segments, visit the whitepaper download page.
Actions we can track
Olark’s integration with Google Analytics works by sending data called “Events” to Google Analytics; these Events consist of an Event Action and a Event Label.
Events [within Google Analytics] are user interactions with content [such as a click] that can be tracked independently from a web page or a screen load. Downloads, mobile ad clicks, gadgets, Flash elements, AJAX embedded elements, and video plays are all examples of actions you might want to track as Events. (Read More)
The different event actions supplied by Olark’s Google Analytics integration are:
- Operator_Sent_a_Message *
- Visitor_Sent_a_Message *
- Conversation *
- Olark_Targeted_Chat_Sent_a_Message *
- Visitor_Sent_an_Offline_Message
In our whitepaper, we focus on the four events noted by * that involve a live operator. Download it now:
Reports we can visualize
With some Goals and Segments created you can work through an abundance of metrics provided by Google Analytics to find actionable intelligence, opportunities that can help us generate ideas for improvement or test hypotheses.
Reports that we’ve found useful include:
- Seeing pages that initiated conversations
- Landing pages for sessions that initiated conversations
- Campaigns and sources that triggered conversations
- Targeted messaging and campaign goals
- A chat that yields a goal completion or sale
- Operator goal conversions or e-commerce results
Each of these reports gives you insight into the different ways in which visitors interact with your website and make use of the chat functionality, or provide insight into how chats are potentially impacting your goal conversions and earnings.
Seeing pages that initiated conversations
One of the first reports we’d want to see to understand user behavior in our site regarding chat would be “which pages have the highest number of conversation initiations” as well as “which pages have the highest rate of conversation initiations”.
Here's one Google Analytics reports method we recommend. Let's take a look:

Steps:
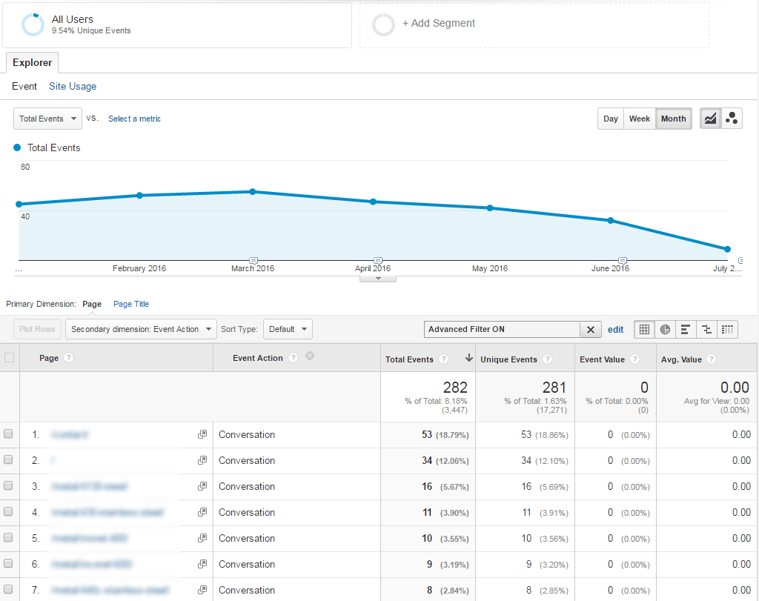
- In the left-hand menu select Behavior > Events > Pages.
- In the data table at the bottom, click on the Secondary Dimension dropdown and click on Event Action (under Behavior).
- Click on the advanced link next to the search box, and in the empty field (after “Include | Event Action | Containing”) enter in Conversation and then click the Apply button at the bottom
This report would give us insight into possible pages that have a high number of chat inquiries, either because of unfulfilled needs (they still don’t understand), or successful content that encouraged the visitor to reach out. Unfortunately we’ll need to get out the calculator to get the percentage of conversation initiations per page as the percentage shown is of the total chat initiations, not the rate per page.
This is just one report we discuss in our full whitepaper. Download it today and learn what other ways you can visualize your live chat data.


